|
SEPATOU : simulator of rotational grazing management in a dairy production
system
|

|
Software
Implementation (Code available on SourceSup)
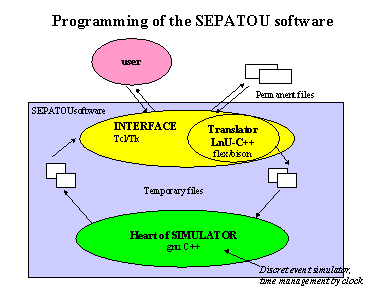
The SEPATOU software is a discrete event simulator with time management
directed by clock.
It is composed of two parts:
-
the user interface essentialy developped with Tcl/Tk,
-
the heart of the simulator, developped with an object approach in GNU
C++.

The heart of the simulator
The discrete-event simulator at the core of SEPATOU is designed to work
as follows. Every day it checks whether a noticeable event has occurred,
and if so, the plans attached to the activities are eventually created
or adapted, using planning rules. By using action rules the general instructions
specified in the plans are then transformed into executable actions that
depend on the current situation of the biophysical system (more precisely
on the decision maker perception of the current situation), the external
environment and the current date. The changes that the actions cause on
the biophysical system are then computed, resulting in a milk production
figure for this day and an updating of the biophysical state that corresponds
at this point to the situation at the beginning of the next day.
The simulator then considers the next day and performs a similar processing.
The iterations are pursued until the end of the simulated period.
Use of the software: a three-step process
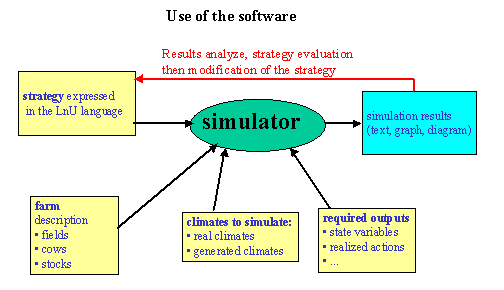
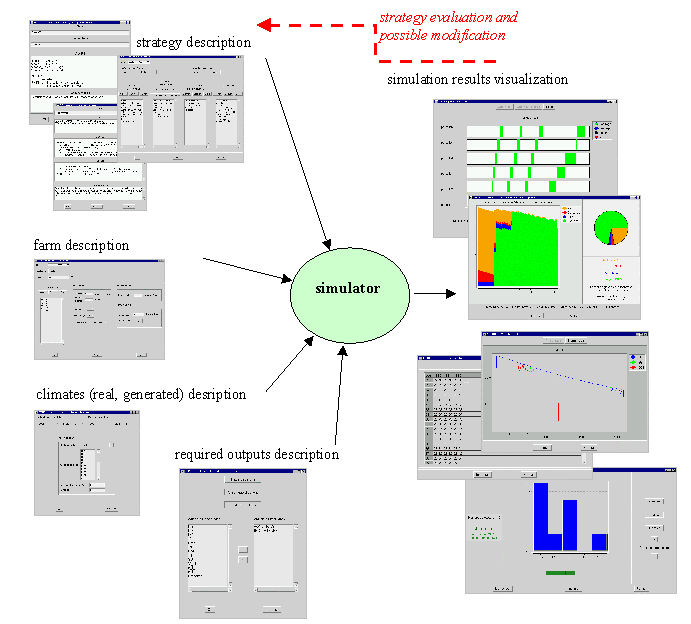
The user must first describe the following inputs:
-
a farm: fields, a herd of cows, stocks of maize silage and hay,
-
a strategy: planning rules, acting rules, indicators and interpretation
functions,
-
a set of climates (real or generated) to simulate,
-
desired outputs after simulation.
The desired outputs need to be specified because their number affects the
time of simulation. For a PC computer with a Pentium III at 500 MHz, the
speed of simulation is 2.3 simulations par second when all possible outputs
are desired and 8.3 simulations per second for the minimum outputs which
are average values for each realized simulation.
The second step encompasses a pre-processing phase and the running of
the simulations. The pre-processing consists in parsing and then translating
the strategy from the LnU language specifically developed for strategy
representation into the C++ programming language in which the simulator
is implemented. The translated strategy must then be compiled and linked
with the code of the simulation mechanism. At this stage simulations with
different climate scenorios can be run.
In the third step, the user can visualise the outputs of simulations.
A set of display options is provided for helping to analyse the results.
The time series of any user-selected variable throughout a set of simulated
years can be visualised: for example, the diet composition throughout one
particular year, or the chronicle of the executed actions concerning rotations,
silage cutting, hay cutting and fertilisation on each pasture.

If the results are not satisfying , the user migth modify the strategy
and vizualize the newly obtained results.
During this trial-and-error process, the user better apprehends the
functionning of the considered complex production system and learns to
better manage it.

Last modifications: January 2018


