|
|
SEPATOU : simulator of rotational grazing management in a dairy production |
|
|
|
|
|
|
|
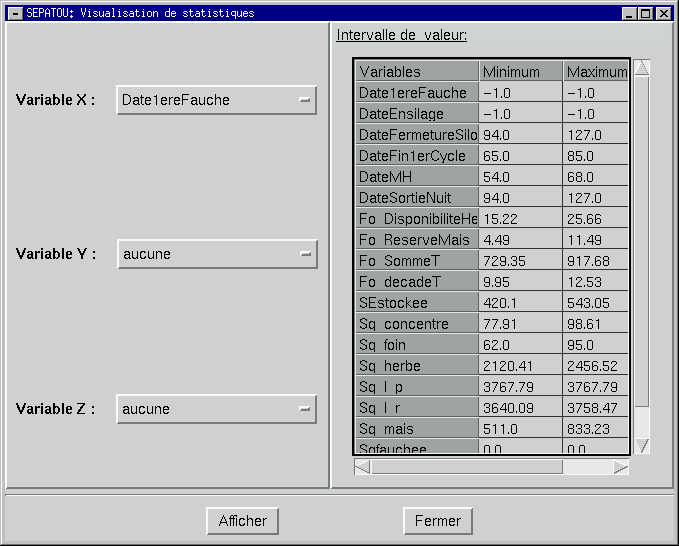
The following window is displayed to select among recorded simulations
results, those to display in order to realize inter-annual analyze.

Window to select and display annual results
Min and max values are initalized based on data but could be modified
by the user.
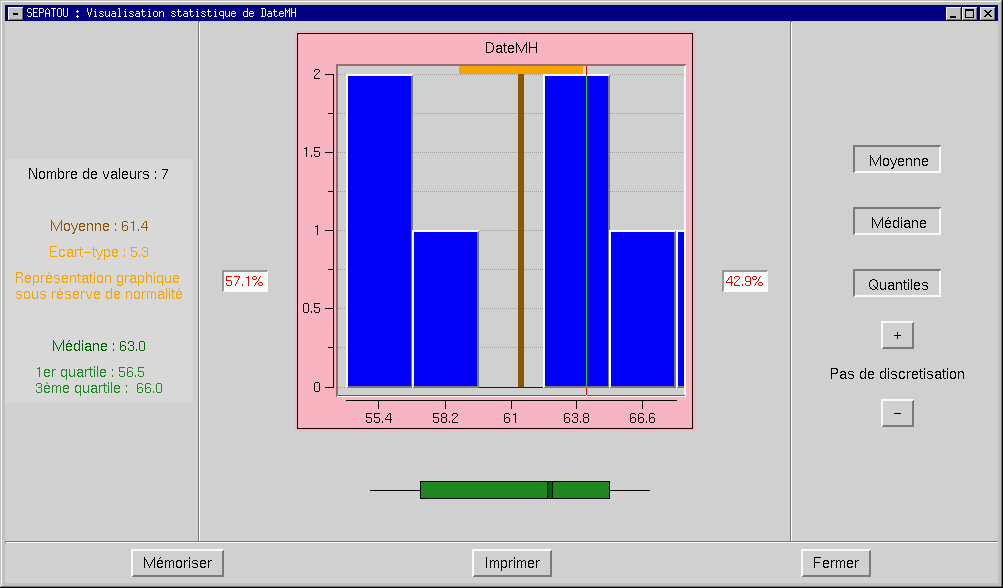
When only one variable (X variable) is selected, the display is on the form of an histogram.

Histogram of values of a numerical variable
The 'Moyenne' button displays the mean and the standard deviation.
The 'Mediane' button displays the median and others quartiles.
The 'Quantiles' button allows to move a vertical line on the histogram
and the percentage of points on each side of the line are displayed.
The '+' and '-' buttons allows to increase or decrease the discretization
step.
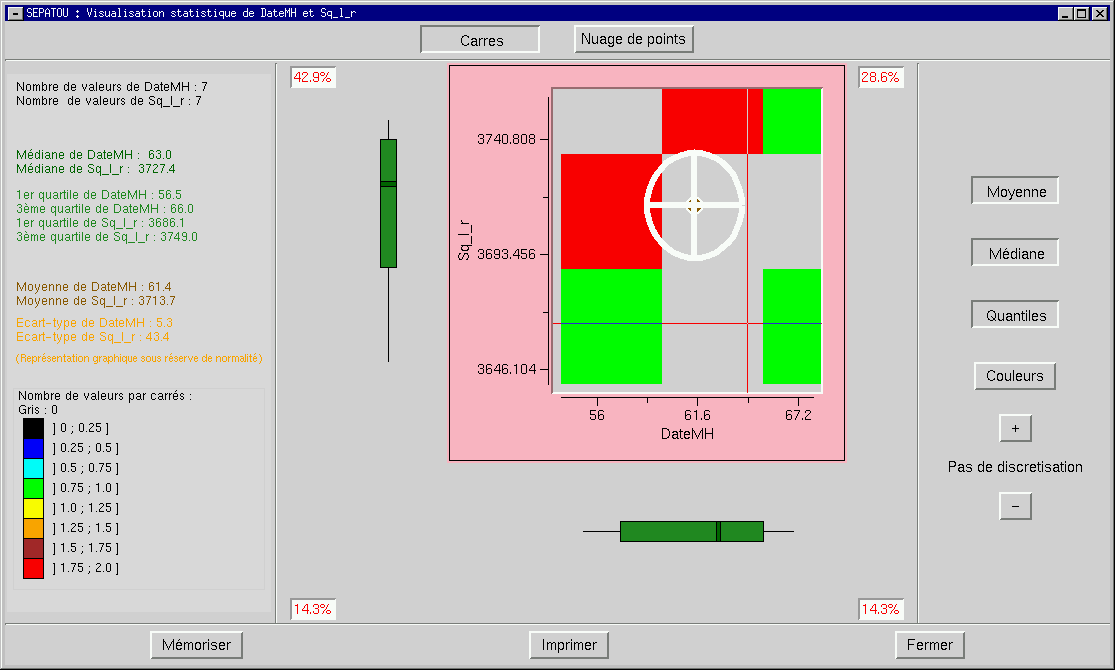
When 2 variables are selected (X and Y variable), the dispaly is done using a plan rules in square. The color of a square is in relation with the number of points found in the square.

Visualization of the values of 2 numerical variables
The 'Moyenne' button displays the mean and the standard deviation.
The 'Mediane' button displays the median and others quartiles.
The 'Quantiles' button allows to move a vertical line on the histogram
and the percentage of points on each side of the line are displayed.
The 'Couleur' button allows to change the used color palette.
The '+' and '-' buttons allows to increase or decrease the discretization
step : the square size.