|
|
SEPATOU : simulator of rotational grazing management in a dairy production system |
|
|
|
|
|
|
|
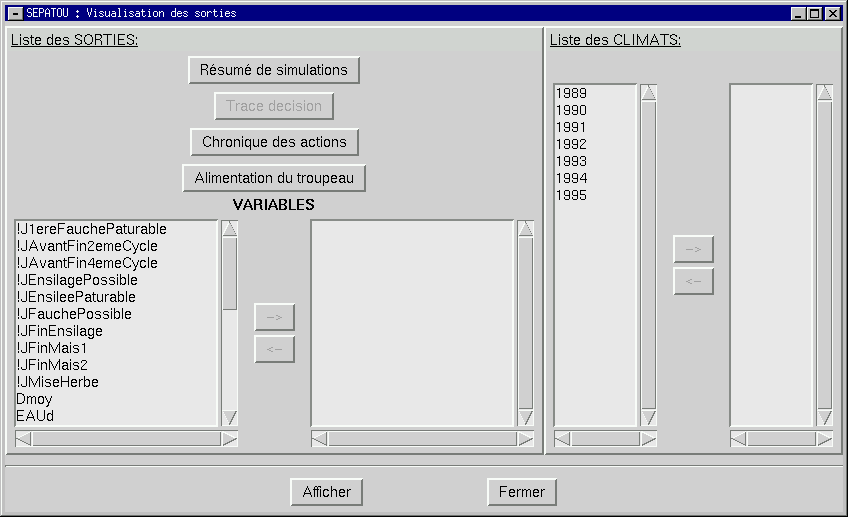
Window to choice and display simulations results for each simulated
year
At rigth, selection of results, at left years to take into account.
The arrow buttons are used to transfer selections from the left
frame (possible choices) to rhe right frame (selections to display) or
vice versa.
The 'Résumé de simulations' button display a table with values of some important variables for each years simulated.
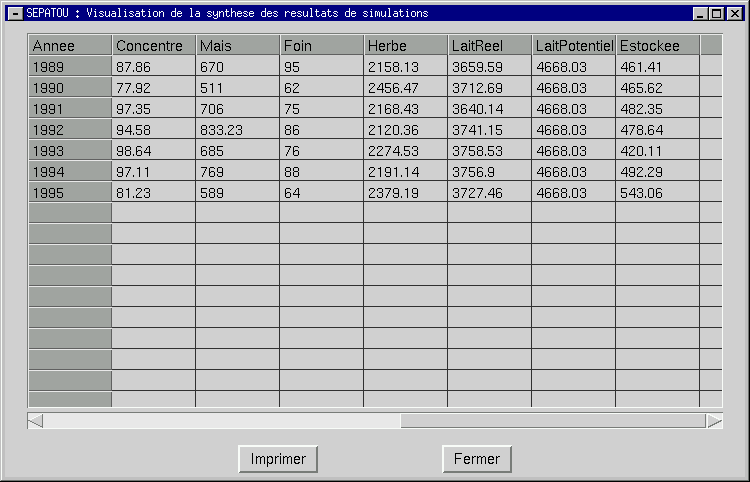
Windows displaying some important variables for various simulated
years
The 'Trace décision' button (here not enabled because this result was not required before simulating) allows to visualize a trace of the decision process day after day. It gives which rules had been tested, fired and which actions had been executed.
The 'Chronique des actions' displays a grazing calendar.
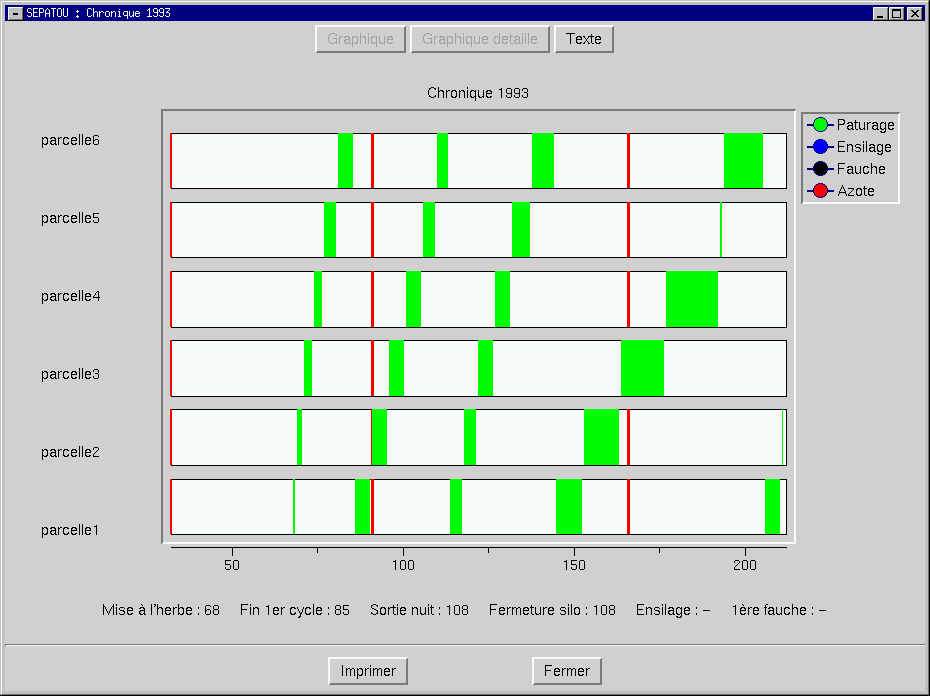
Display of a grazing calendar for a specified year
The 'Texte' button displays a textual description of all realized
actions for this specified year.
The 'Alimentation' button displays the daily feeding repartion of a cow.
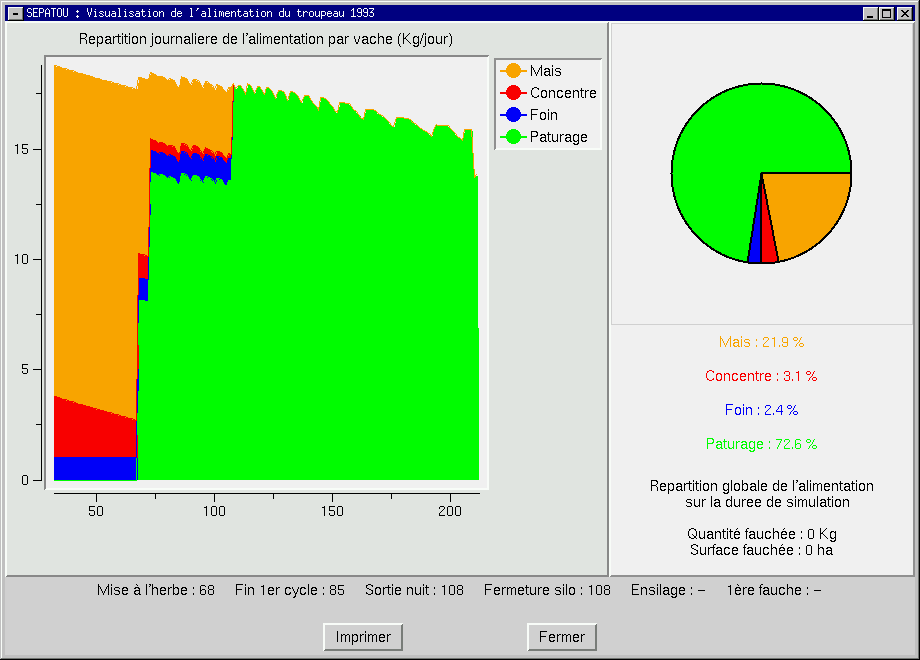
Visualization of the daily feeding repartition of a cow for a
specified year
The display of selected variables will depend of type variables. If a variable is numerical, the display is graphic (curves), if not the display is a table. If the variable is attached to fields, the display allows to navigate from one field to the others successively.
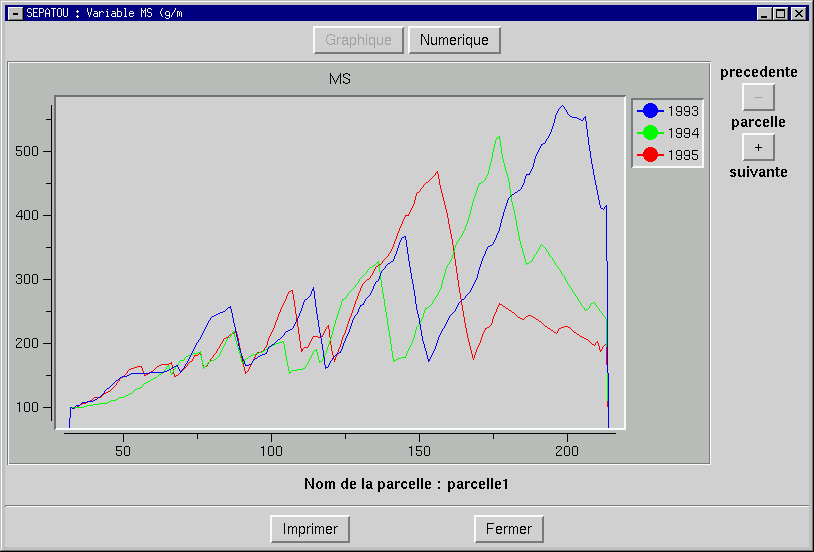
Graphical display of the evolution of a numerical variable (here
dry matter in g/m2 found on a field) for selected years
The 'Numérique' button displays the numeric value of the
variable for each day.
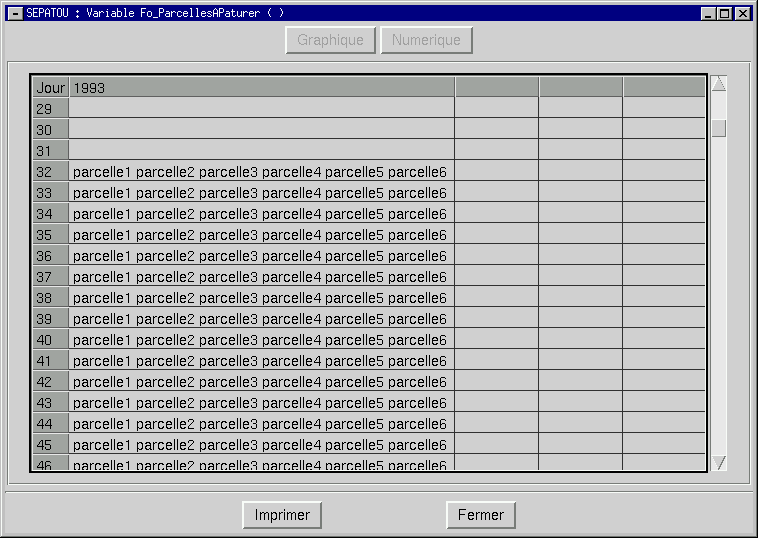
Display of the evolution of a variable (here the set of fields
in the pool of grazable fields) the value of which is a set of name