|
|
SEPATOU : simulator of rotational grazing management in a dairy production system |
|
|
|
|
|
|
|
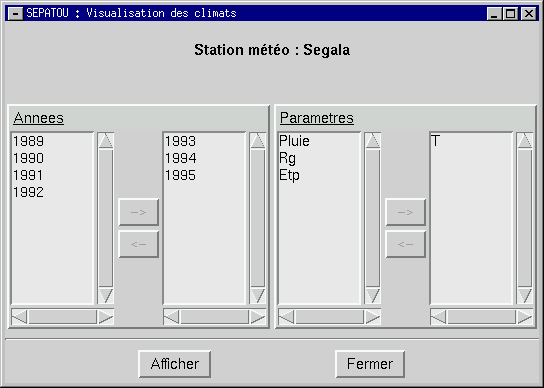
In the folowing window it is possible to select time series of climatic
parameters to be displayed from either real or generated climatic years.

Window to select years and climatic parameters to visualize
The arrow buttons are used to transfer selections from the left
frame (possible choices) to rhe right frame (selections to display) or
vice versa.
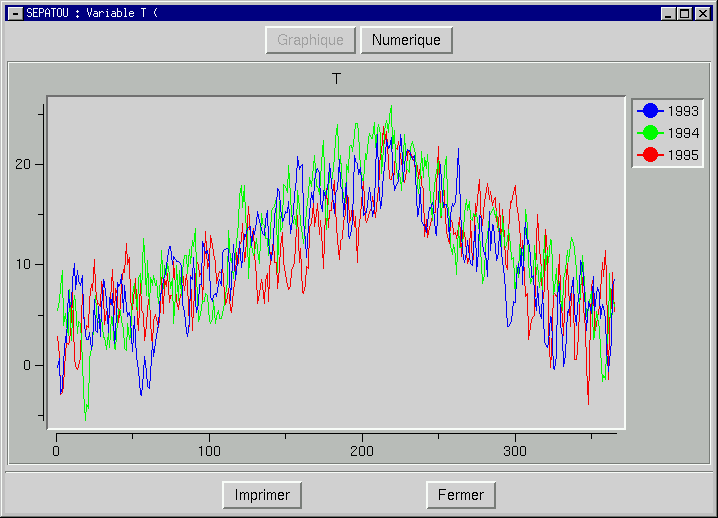
Each selected climatic parameter are displayed in separate window. For example, here is the visualization of the temperature for a set of three real years.

Visualizatin of the temperature (in °C) evolution during 3
real years
The X axis is time counted from 1 to 365 for a year.
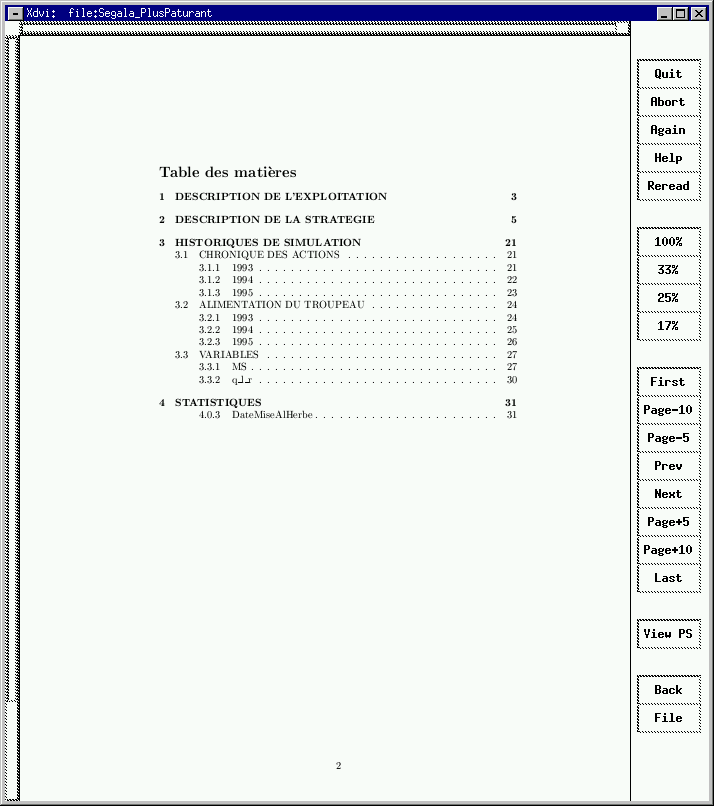
The current report is displayed page after page as shown in the
following window.

Window to visualize the current report page after page

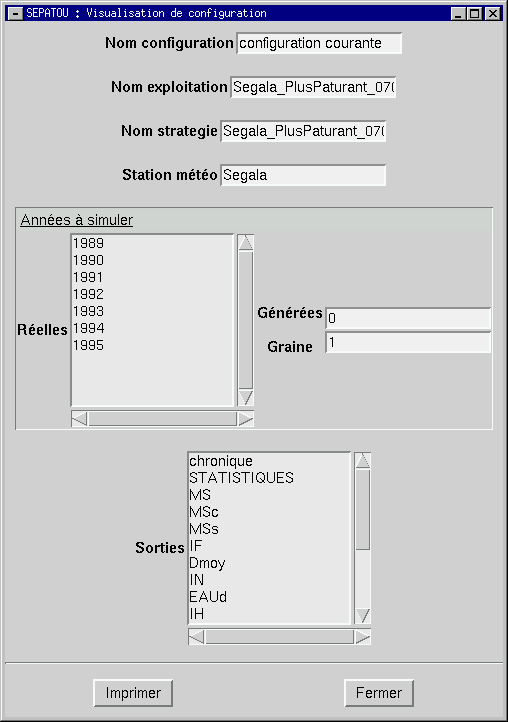
Window to visualize some information about the current configuration